|
|
Scatter Plot
A scatter plot is a type of diagram using Cartesian coordinates to display values for two variables within a set of data. The data is displayed as a collection of points, each having the value of one variable determining the position on the horizontal axis and the value of the other variable determining the position on the vertical axis.
In the example below, data from the sample "cars" dataset is used to plot the car speed vs car stopping distance. ggplot(Data, aes(y = Y-NumericVector, x = X-NumericVector)) + geom_point() Example:
> ggplot(cars, aes(y = dist, x = speed)) + geom_point() 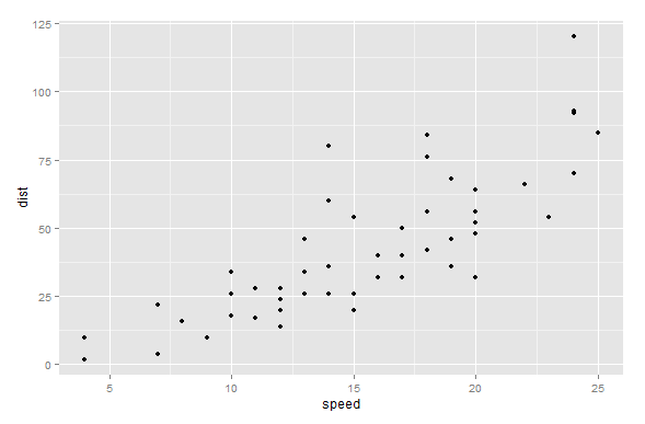
|
