|
|
Density Plot
A density plot is a graphical representation of the distribution of data using a smoothed line plot. In the example below, data from the sample "trees" dataset is used to generate a density plot of tree height.
ggplot(Data, aes(x = NumericVector)) + geom_density() Example:
> ggplot(trees, aes(x = Height)) + geom_density() 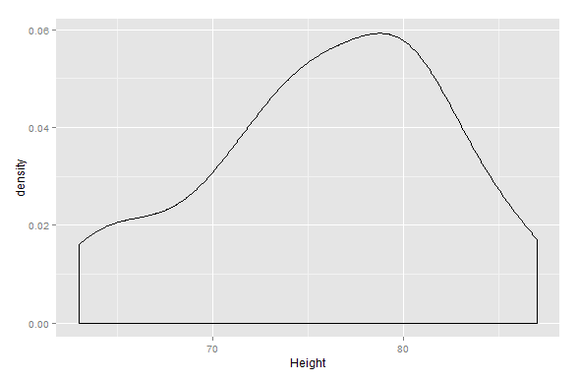
|
